Making activity on a machine visible through security logs.
Overview and purpose
I built a mini Security Operations Center (SOC) lab in VirtualBox to practise security monitoring, simulate attacks, and investigate the logs they produce.
The environment combines Wazuh monitoring infrastructure, an Ubuntu endpoint, and a Kali Linux attacker. I used it to explore how activity on an endpoint becomes security data that can be reviewed in a dashboard.
This project connected several areas I had been learning: Linux administration, networking, attack techniques, and defensive security.
Why I built it
I wanted to understand what happens on the defender’s side when an attack takes place.
Running a security tool is only one part of an experiment. I also wanted to understand what evidence it leaves behind, how that evidence reaches a monitoring system, and what an analyst can learn from it.
The lab gave me a practical environment to investigate these questions while also learning how to configure and troubleshoot the infrastructure supporting security monitoring.
Tools and lab environment
| Component | Role in the project |
|---|---|
| VirtualBox | Hosted the virtual machines and their network connections |
| Wazuh Manager | Analysed incoming endpoint events using detection rules |
| Wazuh Indexer | Stored indexed security data for searching |
| Wazuh Dashboard | Provided the interface for reviewing alerts and events |
| Ubuntu endpoint | Acted as the monitored target |
| Wazuh agent | Collected and forwarded security data from the endpoint |
| Kali Linux | Provided the environment for attack simulations |
| Hydra | Supported the brute-force experiment |
| Netcat | Supported connection and session experiments |
| MITRE ATT&CK | Provided a framework for describing attack behaviour |
The monitoring stack used separate Manager, Indexer, and Dashboard components. Their responsibilities follow the Wazuh architecture.
What was needed
The lab required a computer capable of running several virtual machines, VirtualBox, Linux installation images, and the Wazuh components.
The main setup requirements were:
- Virtual machines for the monitoring infrastructure, endpoint, and attacker.
- Working network connections between the relevant machines.
- A Wazuh agent on the Ubuntu endpoint.
- Test accounts and services for the simulations.
- Dashboard access to inspect the collected security data.
Networking was an essential part of the setup. The monitoring components needed to communicate before the attack experiments could produce useful results in the dashboard.
How I built it
1. Set up the virtual environment
I created the lab in VirtualBox, separating the monitoring infrastructure from the Ubuntu endpoint and Kali Linux attacker.
This made the role of each machine clear: one generated test activity, another recorded the effects, and the monitoring stack collected and presented the evidence.
2. Configure networking
I worked with NAT, Host-Only, and Internal Network adapters while configuring connectivity between the machines.
One of the main challenges was establishing reliable communication between the Ubuntu agent and the Wazuh server. Troubleshooting these connections helped me understand how VirtualBox network settings affect the monitoring pipeline.
3. Deploy the monitoring components
I configured the Wazuh Manager, Indexer, and Dashboard, then connected the Ubuntu endpoint through the Wazuh agent.
This established the path from endpoint activity to centrally searchable security data.
4. Run attack simulations
With the monitoring environment in place, I carried out experiments involving brute force, sudo abuse, and Netcat-based activity.
These scenarios provided different types of activity to investigate and helped connect attack behaviour with the evidence available to a defender.
5. Review logs and alerts
I used the Wazuh Dashboard to monitor and analyse the collected data.
The investigation focused on understanding the relationship between the test activity, the endpoint logs, and the alerts presented by Wazuh.
How it works
The lab follows a security-monitoring pipeline:
- Activity takes place on the Ubuntu endpoint.
- The endpoint produces relevant security events.
- The Wazuh agent collects and forwards configured data.
- The Wazuh Manager analyses incoming events.
- Alert data is indexed for searching.
- I review the results through the Wazuh Dashboard.
This helped me understand why a working dashboard alone does not guarantee useful monitoring. The endpoint must generate relevant evidence, the agent must collect it, and the monitoring system must receive and interpret it.
Simulated attack scenarios
Brute force
I used Hydra to simulate repeated authentication attempts against the lab endpoint.
The purpose was to explore how repeated login activity appears in security logs and how those events can support an investigation.
This scenario was mapped to MITRE ATT&CK T1110 — Brute Force.
Privilege escalation through sudo abuse
I explored a privilege-escalation scenario involving sudo abuse.
The aim was to understand how elevated command execution relates to endpoint monitoring and what evidence is available when investigating privileged activity.
The project documented this scenario under MITRE ATT&CK T1548.003 — Sudo and Sudo Caching.
Netcat-based activity
I used Netcat as part of the lab’s connection and session experiments.
This scenario helped me explore the relationship between activity performed on a machine and the evidence available through endpoint monitoring.
The ATT&CK mapping depends on the behaviour demonstrated. A Valid Accounts mapping applies when legitimate credentials are abused for access; the use of Netcat itself does not establish that technique.
Main technical challenge
The main infrastructure challenge was agent–server communication.
The lab involved several virtual machines and different VirtualBox network modes. Getting those connections working was necessary before I could reliably investigate endpoint activity through Wazuh.
This reinforced an important lesson: a missing alert does not immediately mean a detection rule failed. The issue may occur earlier, such as the event not being collected or the agent being unable to reach the server.
Results
I built a working virtual SOC environment and used the Wazuh Dashboard to monitor and analyse security data from the lab.
The project gave me practical experience in:
- Deploying a monitoring stack with separate components.
- Connecting a Linux endpoint to Wazuh.
- Troubleshooting virtual networking.
- Running controlled attack simulations.
- Investigating logs and alerts.
- Relating attack behaviour to MITRE ATT&CK.
The main outcome was understanding the complete path from endpoint activity to investigation, including the infrastructure needed to make that path work.
Lab images
Architecture overview
The diagram shows the relationship between the Kali Linux attacker, monitored Ubuntu endpoint, and Wazuh monitoring components.

Terminal experiments
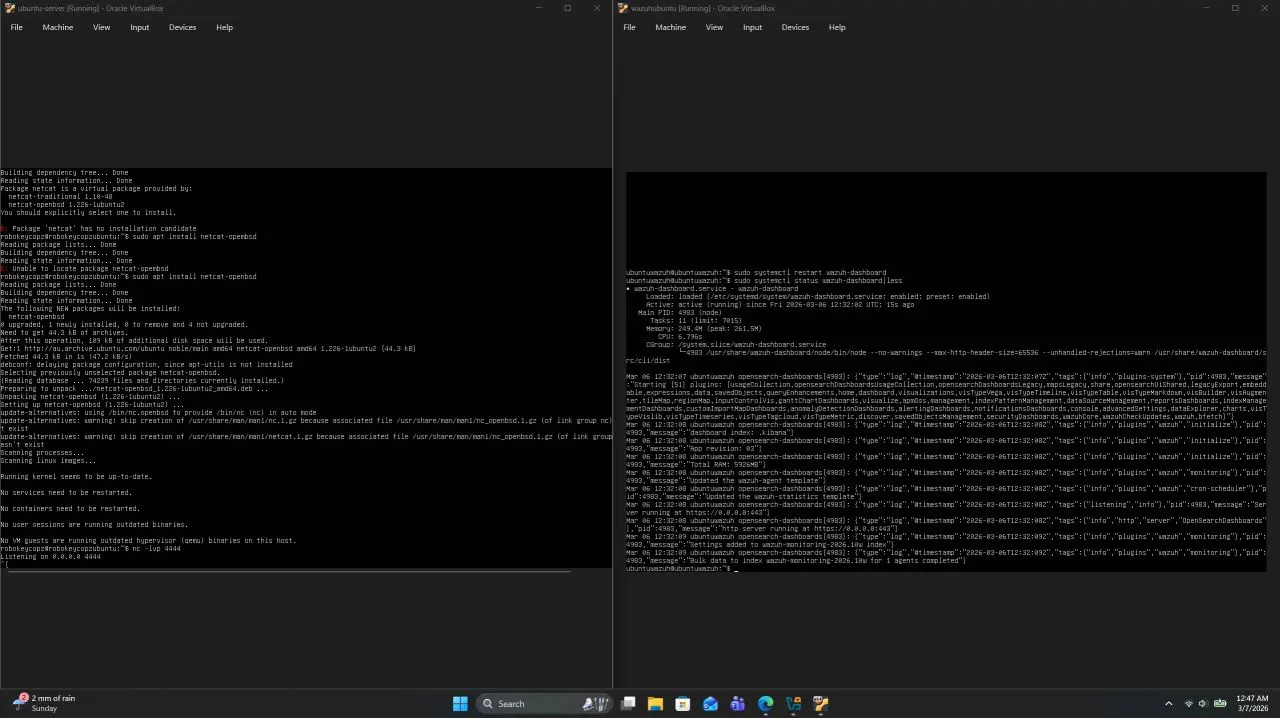
These screenshots document the command-line work involved in configuring the environment and carrying out the simulations.
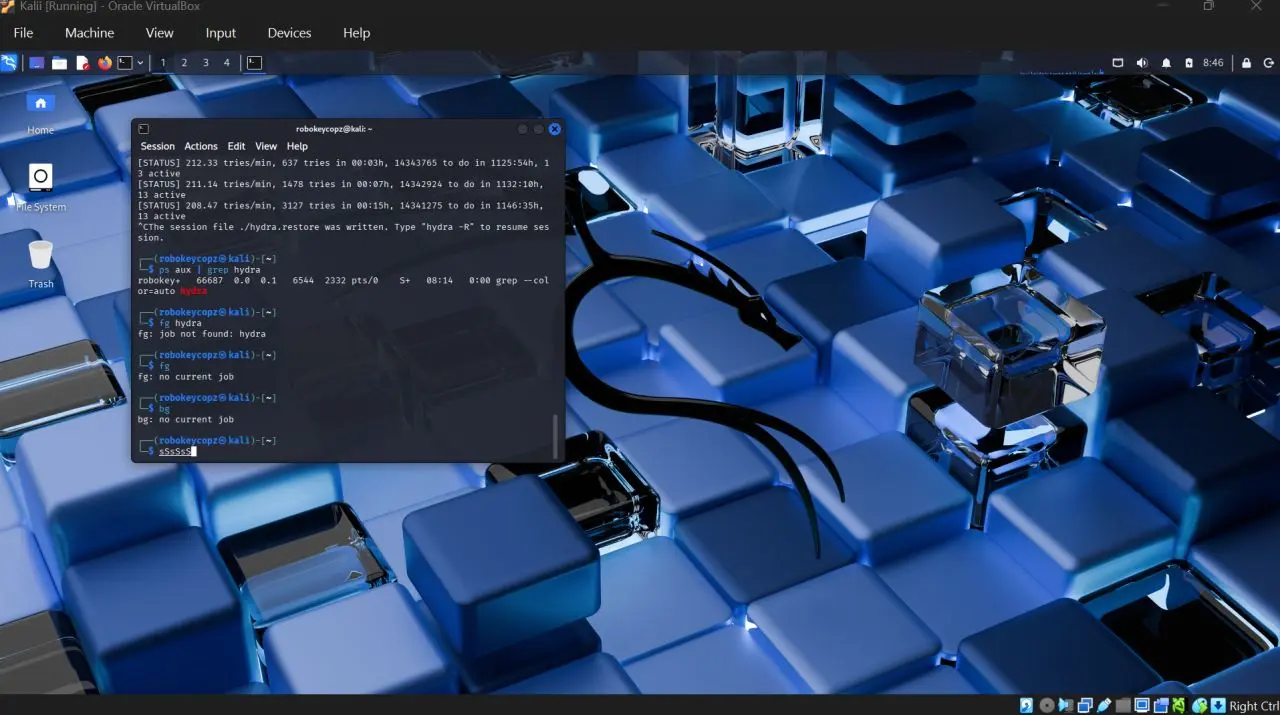
Kali Linux environment
This screenshot shows the attacker-side environment used during the lab experiments.
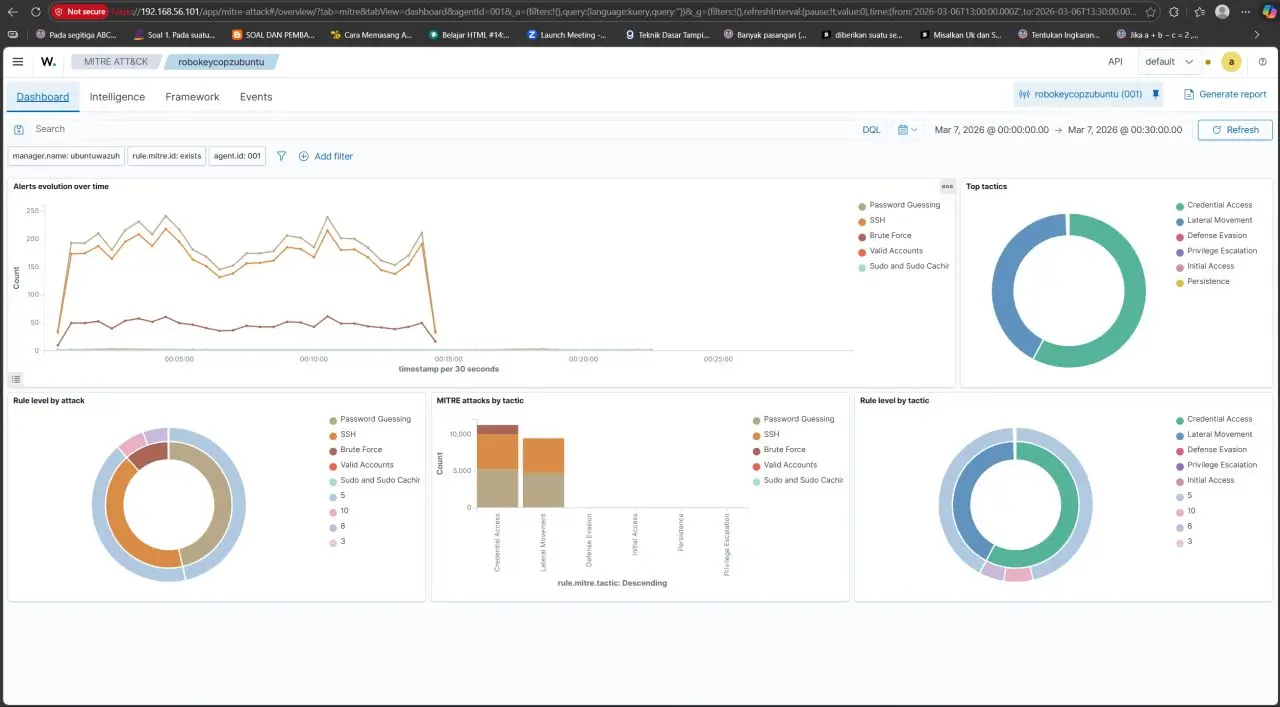
Wazuh dashboard overview
The dashboard provides a visual overview of collected security information and the categories available for investigation.
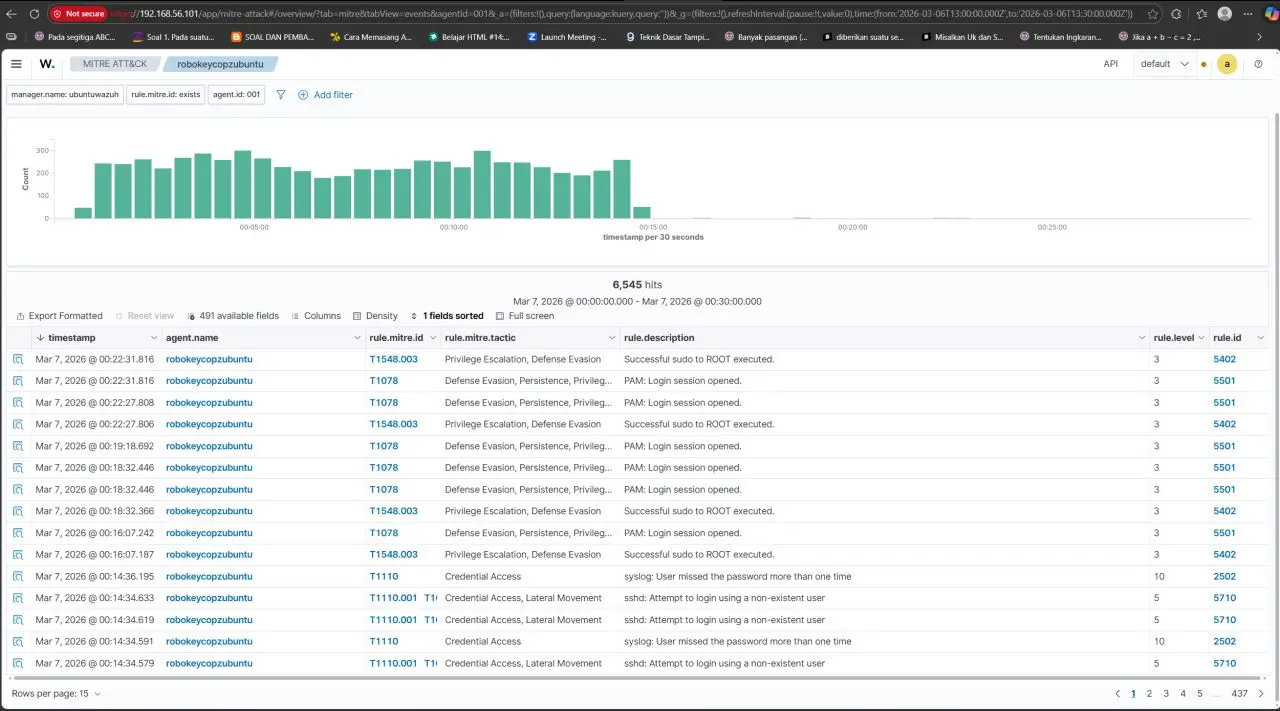
Event investigation
The event list shows how individual records can be inspected beyond the dashboard’s summary charts.
What I learned
This project helped me connect offensive activity with defensive investigation.
I learned that security monitoring depends on more than installing a tool. Network connectivity, endpoint configuration, log collection, and interpretation all affect what a defender can see.
I also developed a better understanding of MITRE ATT&CK: a technique describes behaviour, so its mapping needs to be supported by what actually happened during an experiment.
Future improvements
I would like to extend the lab by:
- Recording reproducible steps for each scenario.
- Adding annotated logs and alerts to the write-up.
- Comparing normal activity with suspicious activity.
- Testing custom detection rules.
- Documenting false positives and visibility gaps.
- Adding more monitored endpoints.
These improvements would make the lab easier to reproduce and provide stronger evidence for evaluating individual detections.